Friday, April 20, 2012

Thematic Mapping


Hi everyone,

I finally got a chance to work on this lab....

-First I started out by importing the data set into ArcMap... below is a screen shot of the imported data.


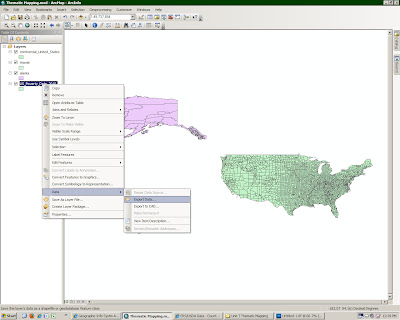
-Next I used the select tool and separate the map into three shape files: the contiguous US, Alaska, and Hawaii... below is a screen shot of the method that was used.


 -The next step was to set the spatial reference of the US county shape file to "USA Contiguous Albers Equal Area Conic projection, the Alaska shape file to Alaska Equal Area Projection, and the Hawaii shape file to Hawaii Equal Area projection... below is a screen shot of the method that was used.


-Next I reprojected the three shape files to the correct projection.


-Next I looked at the classification first using Natural breaks (jenks).


-Secondly I looked at the classification using Quantiles.


-Third I looked at the classification using Equal Intervals.


-Lastly I looked at the classification using Standard Deviation.


- After creating all four classifications I believe "natural breaks (jenks)" works the best for the data set that is being analyzed.  Below is the maps I created with the data showing the poverty rates in the United States.


Monday, April 2, 2012

Exploratory Data Analysis in GIS

Hi everyone!!
I finaly got some time to work on the lab.

For Section 1 by hand
1) data: 67.3, 61.8, 63.7, 62.4, 65.6, 66.2, 69.8, 63.9, 45.8, 78, 32, 68.0
a) mean: 62.04

data / number of occurrences = mean

(67.3 + 61.8 + 63.7 + 62.4 + 65.6 + 66.2 + 69.8 + 63.9 + 45.8 + 78 + 32 + 68.0) / 12 = mean

b) variance: 143.70

data – mean = (x) squared = y

67.3 - 62.04 = (5.26) squared = 27.6676 
61.8 - 62.04 = (-0.24) squared = 0.0576
63.7 - 62.04 = (1.66) squared = 2.7556
62.4 - 62.04 = (0.36) squared = 0.1296
65.6 - 62.04 = (3.56) squared = 12.6736
66.2 - 62.04 = (4.16) squared = 17.3056
69.8 - 62.04 = (7.76) squared = 60.2176
63.9 - 62.04 = (1.86) squared = 3.4596
45.8 - 62.04 = (-16.24) squared = 263.7376
78.0 - 62.04 = (15.96) squared = 254.7216
32.0 - 62.04 = (-30.04) squared = 902.4016
68.0 - 62.04 = (5.96) squared = 35.5216

(y1 +  y2 +  y3 +  y4 +  y5 +  y6 +  y7 +  y8 +  y9 +  y10 +  y11 +  y12) / 12 = variance

c) standard deviation: 11.99

Standard deviation = square root (variance)

For Section 2 of the lab using "R"
Using “R”
> commute = c(67.3, 61.8, 63.7, 62.4, 65.6, 66.2, 69.8, 63.9, 45.8, 78, 32, 68.0)
> commute
 [1] 67.3 61.8 63.7 62.4 65.6 66.2 69.8 63.9 45.8 78.0 32.0 68.0
> mean (commute)
[1] 62.04167
> sd (commute)
[1] 11.9873
> var (commute)
[1] 143.6954
INPUT into “R”….
> hist(commute, xlab ="Commute Time", main ="Histogram of Commute Time", col = 3, breaks = 6)

INPUT into “R”….
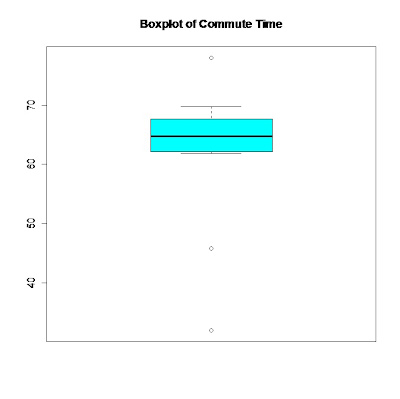
> boxplot(commute, main = "Boxplot of Commute Time", col = 5)

INPUT into “R”….
> qqnorm(commute, main = "Commute Time")                                
> qqline(commute)

For Section 3 of the lab using ArcGIS...
-I started out inputing the earthquake data, and reprojecting using....
Data Mangment Tools
>Projected and Transfomations
>Feature
> Project

Project Coordinate System
>Continential
>North America
>Noth America Equal Area Conic.prj OR Alaka Albers Equal Area Conic.prj...

-below I found the mean center/meadian center using the following tool in "tool box"
Spatial Statistic Tools
>Measuring Geographic Distrubution
>Mean Center
 OR
>Median Center


-below I used the Geostatistical Analyst Tool, first you had to go to...
Customerize
>Extenision
>Geostatistical Analyst
THEN
Customerize
>toolbars
>Geostatistical Analyst
WHEN the tool bar is present click on the...
Geostatistical Analyst
>Explore Data
 >Historgram


-below I used the Geostatistical Analyst Tool, first you had to go to...
Customerize
>Extenision
>Geostatistical Analyst
THEN
Customerize
>toolbars
>Geostatistical Analyst
WHEN the tool bar is present click on the...
Geostatistical Analyst
>Explore Data
>QQ plot


-below I found the mean center/meadian center using the following tool in "tool box"
Spatial Statistic Tools
>Measuring Geographic Distrubution
>Directional Distrubution


-below I used the Geostatistical Analyst Tool, first you had to go to...
Customerize
>Extenision
>Geostatistical Analyst
THEN
Customerize
>toolbars
>Geostatistical Analyst
WHEN the tool bar is present click on the...
Geostatistical Analyst
>Explore Data
>Voronoi Map

Monday, March 19, 2012

Spatial Interpolation


Hi everyone,

I started the lab for Spatial Interpolation last week below are the results that I got for the two different methods I used.


Using the tool found in the Arc Tool Box > Spaital Analyst Tools > Interpolation > IDW...I ended us with the below result. 
IDW (Inverse Distance Weighting)


Using the tool found in the Arc Tool Box > Spaital Analyst Tools > Interpolation > Spline...I ended us with the below result.
Spline

In both maps the results show their is a high fecal cola form concentration in the Northwest part of the bay, which would give officials reasons to focus clean up efforts in that location.

Monday, March 5, 2012

Map Algebra and Spatial Analysis lab

Hi everyone!!

The following is a step by step of the process until I ran into a road block :-(

Below we have the two DEM that I retrieved from the seamless server... I picked the Little Colorado at Woodruff, AZ.


Next I set the environment and processing extent. (see below)
Geoprocessing>Environment


Next I megered the two DEM's
Arctoolbox>Data Mangement Tools>Raster>Raster Dataset>Moasic to New Raster


Next I reprojected the merged DEM.
Arctoolbox>Data Management Tools>Project and Transformation>Raster>Project Raster


Notice that the read out in the lower right is now meters in the picture...which was created by going to Insert>Add New Data Set


Next I created a hill shade using the reprojected DEM.
Arctoolbox>3D Analyst Tools>Raster Surface>Hill Shade


Now I created the below using the fill command.
Arctoolbox>Spatial Analyst Tools>Hydrology>Fill


Now I created a flow direction (below)
Arctoolbox>Spatial Analyst Tools>Hydrology>Flowdirection


At this point I tried creating a Flow accumulation raster but I was unable too.  Every time I tried using the tool it would run, run and run....  I also tried to trouble shooting.... by creating a smaller area and that didn't work either.  So I thought of one more thing that I am going to try during class.... hopefully it works, unless anyone else knows something that I don't know.

Monday, February 6, 2012

Downloading and Using DEM for Watershed and Stream Delineation...Cont.

I was back at it this past weekend :-)

I used the hill shade command...
Arctoolbox>3D Analyst Tools>Raster Surface>Hill Shade
...below is the result of using the hill shade command.


I used the fill command...
Arctoolbox>Spatial Analyst Tools>Hydrology>Fill
...below is the result of using the fill command.


I used the flow direction command...
Arctoolbox>Spatial Analyst Tools>Hydrology>flow direction
...below is the result of using the flow direction command.


I used the flow accumulation command...
Arctoolbox>Spatial Analyst Tools>Hydrology>flow accumulation
...below is the result of using the flow accumulation command.


I used the raster calculator command...
Arctoolbox>Spatial Analyst Tools>Hydrology>raster calculator
...below is the result of using the raster calculator command.


At this point I was lost.... so hopefully I can get some help during class this week.

Monday, January 30, 2012

Downloading and Using DEM for Watershed and Stream Delineation

I decided to start the lab for this week since I had some free time...this is what I got though so far.

First I stated by going to the site http://seamless.usgs.gov/ the above is what I saw.  As I read the directions I did noticed that the second step should of read as follows...

2. At the left hand side of the Welcome Page click on "Seamless Viewer" under the tools to Access Data.


When I followed the revised directions for number two, I saw the above :-)


I decided to zoom into the LA area, because I am planning to go to the National Planning Conference in April, so I wanted to get a lay of the land.


When selecting the area to down load (step #6), I saw the above. 

Note: The directions on the word document should read "left" instead of "right".


After I created a rectangle around the area I wish to download I saw the above.  I waited 15 mins and it still has not downloaded yet.  I think I need to pick a smaller area.


I zoomed in a little tighter (the above image), and I was able to download the info now :-)


Dang! I have to reprojected the raster :-I


Above is how I reprojected the raster.

I think I am done for today, see you all on the flip side :-D

Tuesday, January 24, 2012

Terrain Analysis - Assignment Section 1

This is the DEM (that was downloaded from the CGI website) of the Bay County located in the great state of Michigan!   
After running the "slope tool" found by flowing this path (Acr tool box>3D Analyst tools>Raster Surface>Slope) I ended up with the above results.

After running the "aspect tool" found by flowing this path (Acr tool box>3D Analyst tools>Raster Surface>aspect) I ended up with the above results.

After running the "hill shade tool" found by flowing this path (Acr tool box>3D Analyst tools>Raster Surface>hill shade) I ended up with the above results.

After running the "curvature tool" found by flowing this path (Acr tool box>3D Analyst tools>Raster Surface>curvature) I ended up with the above results.


And finally After running the "raster to tin tool" found by flowing this path  (Acr tool box>Conversions>From Raster>Raster to Tin) I ended up with the above results.

So far I am on the right track....now i just need to put these maps on some paper :-)