Hi everyone,
I finally got a chance to work on this lab....
-First I started out by importing the data set into ArcMap... below is a screen shot of the imported data.

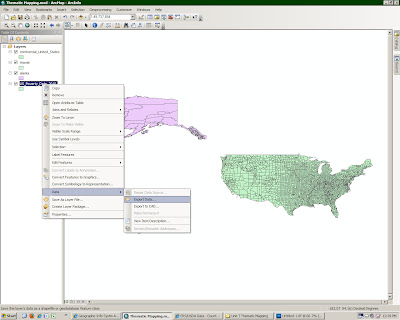
-Next I used the select tool and separate the map into three shape files: the contiguous
US, Alaska, and Hawaii... below is a screen shot of the method that was used.

-Next I reprojected the three shape files to the correct projection.

-Next I looked at the classification first using Natural breaks (jenks).

-Secondly I looked at the classification using Quantiles.

-Third I looked at the classification using Equal Intervals.

-Lastly I looked at the classification using Standard Deviation.

- After creating all four classifications I believe "natural breaks (jenks)" works the best for the data set that is being analyzed. Below is the maps I created with the data showing the poverty rates in the United States.

No comments:
Post a Comment